
Air quality in our cities has become a key concern for both public health and urban planning. According to studies by the Urban Atlas and other environmental research bodies, local actions can significantly reduce air pollution—by over 30%—while also lowering citizens’ exposure to harmful pollutants.
Spain has taken the European air quality and greenhouse gas emission (GHG) reduction targets seriously. Under Law 7/2021 on Climate Change and Energy Transition, the country requires all 149 municipalities with more than 50,000 inhabitants to implement a Low Emission Zone (LEZ).
To support municipalities in designing these LEZs, Royal Decree 1052/2022 sets minimum requirements regarding air quality, climate change, modal shift, energy efficiency, and noise. While it outlines basic criteria, it also respects local autonomy and does not override municipal competencies, allowing cities considerable discretion in how they implement the zones.
However, many local governments, despite managing or planning their LEZs, lack specialized expertise in air quality and often face uncertainty when deciding where to install monitoring sensors.
Why Proper Sensor Placement Matters
For air quality policies to be effective, data must be accurate and representative. Poor placement can lead to skewed or unhelpful data, which limits both analysis and informed decision-making. Therefore, it is essential to define scientific and technical criteria to determine where sensors should be located to provide a true picture of the urban environment.
Methodological Approach
Cities of all sizes often ask Bettair for guidance on sensor placement. We first tackled this challenge in 2021, during the European MappingAir Project, where we installed about 40 sensors across Rome. It quickly became evident that selecting optimal sensor locations would be complex, so we developed a methodology that combines Land Use Regression (LUR) to achieve optimal planning.
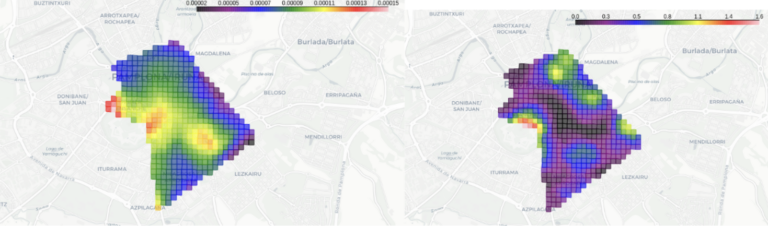
Land Use Regression is a statistical method used to estimate the spatial distribution of air pollutants based on geographic and land-use variables. This approach is highly resource-efficient and aims to identify locations that best represent the air people actually breathe in a given city.
- Data Collection and Analysis
The first phase involves massive data ingestion from geospatial, environmental, and urban sources. Importantly, paid data is not necessary. Several high-quality, free data sources are available. Among the most valuable are:
- OpenStreetMap (OSM)
- Centro Nacional de Información Geográfica (CNIG)
- Urban Atlas (Copernicus Programme)

OpenStreetMap (OSM) is a large, collaborative project to create editable, open-access maps. While the maps themselves are useful, the real asset lies in the geodata generated from GPS devices, aerial imagery, and other open sources. These vector-based geographic datasets are freely licensed and highly valuable for estimating road sizes and traffic volumes—key proxies for pollution levels.
Though not perfectly accurate, OSM data allows us to classify areas by their emission profiles, helping us identify zones that likely share similar pollution characteristics.
CNIG, Spain’s National Geographic Information Center, is a public agency under the Ministry of Transport and Sustainable Mobility. It offers free access to topographic maps, aerial and satellite imagery, digital elevation models, and more. For our purposes, we use altimetry (elevation data) from CNIG as a core variable.
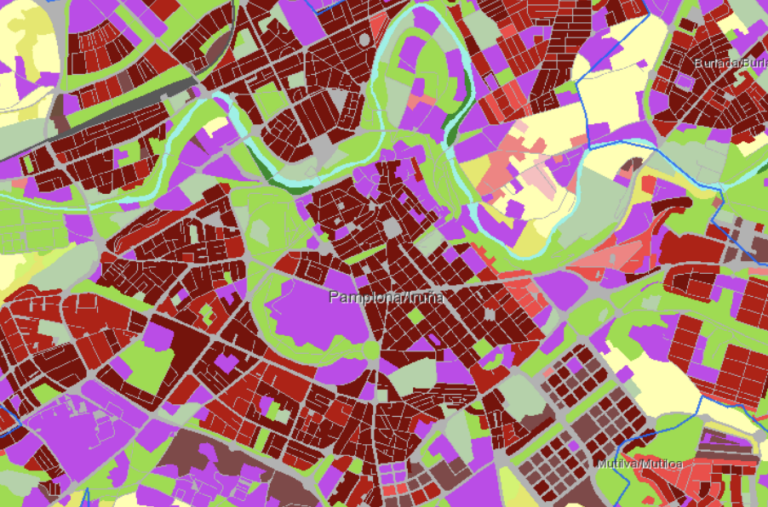
Urban Atlas, part of the Copernicus Programme, is managed by the European Commission and offers high-resolution, up-to-date satellite maps of land use and urban structure. Its detailed classification system is especially useful for understanding residential, industrial, commercial, and green space distributions.
By combining these data sources, we can analyze a wide range of variables such as:
- Road types and densities (from OSM)
- Building heights (from CNIG)
- Land use categories (from Urban Atlas)
- Urban Area Segmentation
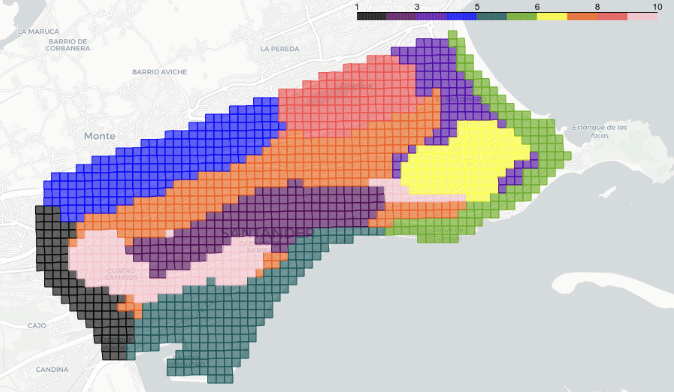
Using these data, our algorithm segments the city into zones based on common features such as urban density, residential or commercial use, and emission profiles. This clustering process allows us to group areas with similar behavior regarding air quality.
- Selection of Strategic Points
After segmentation, the next step is to identify optimal sensor locations within each zone. These sites are selected to ensure that collected data accurately reflects the full urban diversity. As a result, fewer sensors are needed to cover a wider range of conditions effectively.
- Micro-Deployment
Once macro-locations are identified, the goal is to determine the exact spot for each device—on which specific lamppost, traffic light, or wall, for example. This stage follows the guidance of Directive 2008/50/EC, transposed into Spanish law under Royal Decree 102/2011.
Key recommendations include:
- Avoid placing sensors near direct emission sources (chimneys, air vents, etc.)
- Do not install sensors directly above or below windows—keep at least 1 meter away
- Position sensors at breathing height, typically between 1.5 and 4 meters
- Ensure access to power and connectivity for smart devices
We also verify the absence of obstacles that could compromise installation, such as lack of power sources or insufficient solar exposure (for solar-powered sensors) throughout the day and year.
Conclusion
Placing air quality sensors is not merely a logistical challenge—it is a strategic decision. By combining data science, urban expertise, and sensor technology, cities can build monitoring networks that are more efficient and effective. This empowers municipalities to fight pollution, design better policies, and protect public health with evidence-based strategies.